How do you measure 'doing well' online?!
When you run an eCommerce website, you'll want to know how well you are doing online. But how do you measure 'doing well'?!
It is essential to understand what data you'd like to measure and how to 'mine' this data, if you are going to successfully track your online growth.
1) Decide your KPIs
For every eCommerce store, there will be different 'Key Performance Indicators' (KPIs) that will indicate how well your online business is doing. Some examples of KPI's are below:
- Monthly Volume of Sales (Broken down into Brand/Category)
- Monthly Volume of Web Visitors
- Weekly Average Cart Abandonment Rate
- Weekly Volume of Newsletter Signups
It is important that you define your own KPI's as every business is different. A KPI must contain a subject (i.e. visitors, sales, carts), a metric (i.e. volume, average) and a time period. This ensures your KPI is measurable.
2) Understand the Reporting Tools at your disposal
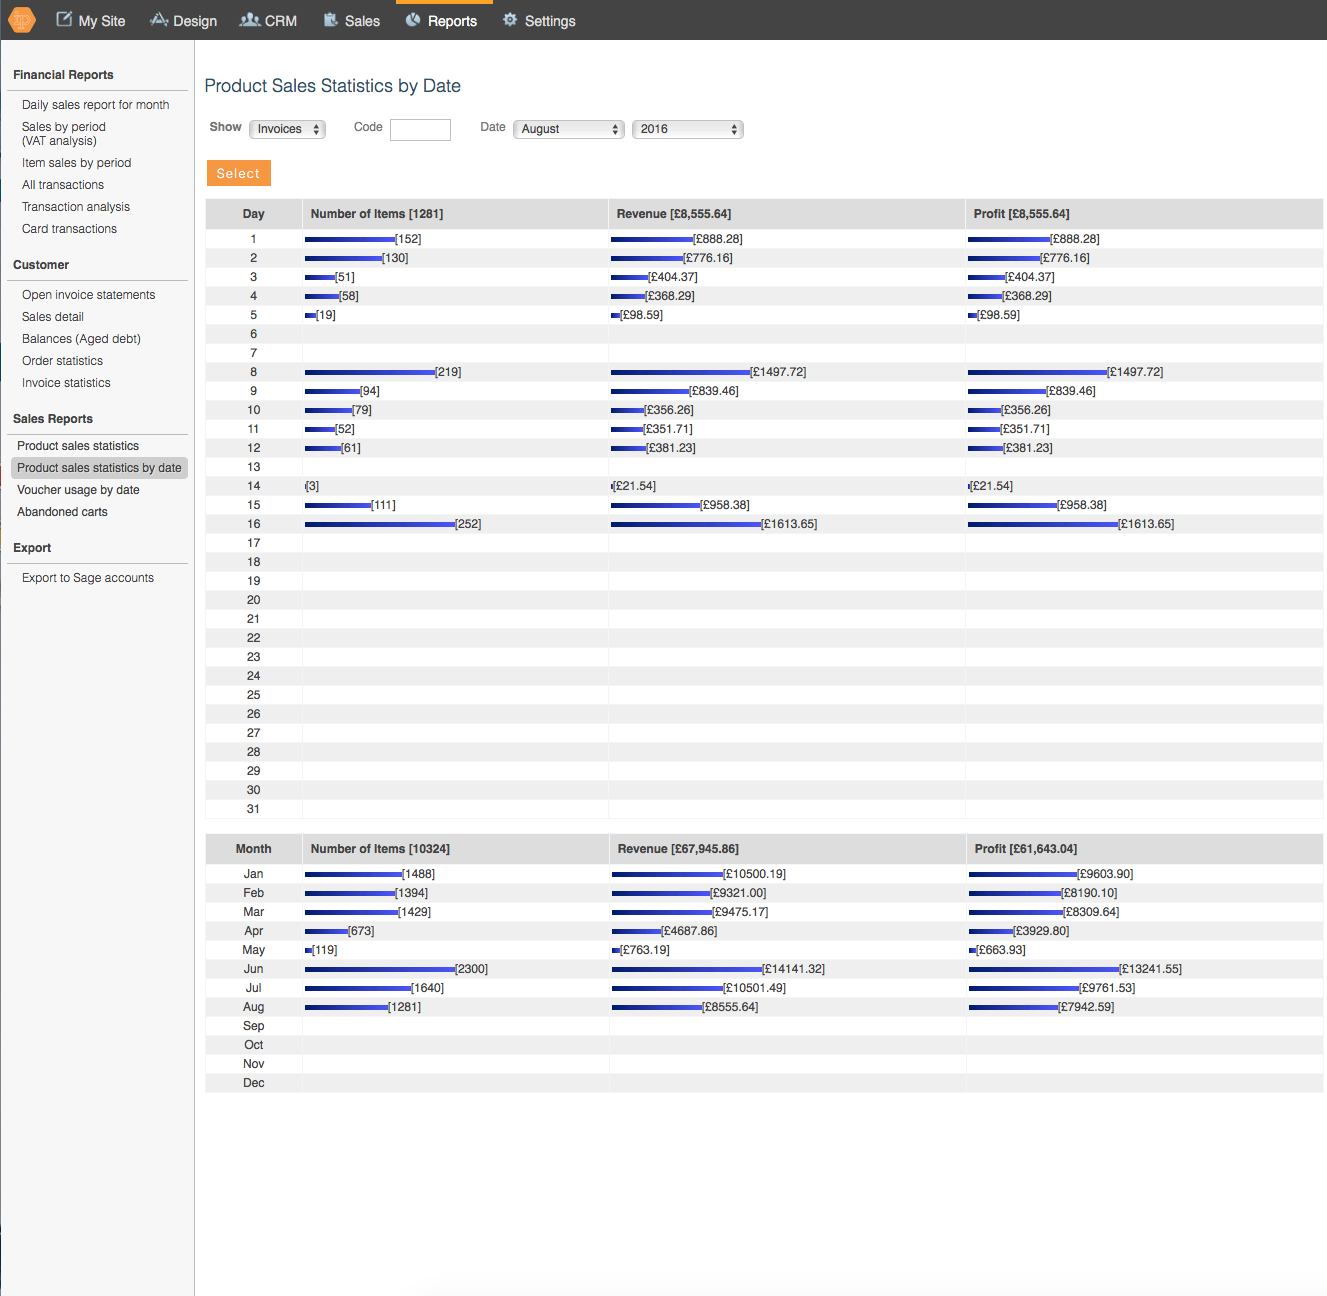
Now you have your KPIs, you'll need to gather this information. Within iPages you can report on your sales, visitors, cart abandonment, and customer details using in-built reports.
With full VAT reporting, accounting breakdowns and the ability to search per product, brand, customer and tag, you can create bespoke reports on your web sales.
Because the reports are built in to your website, they are able to use data on all aspects of your ecommerce store; your customers, products, stock and vouchers.

Along with in-built reports, iPages also uses PIWIK webstats to provide reports on website activity. From daily visitor stats to entry/exit pages and bounce rates, PIWIK provide extensive data to help you understand your customer behaviour.
3) Become an effective 'data miner'
So, you've got your KPIs and your relavent data but now what? Many people can report on data. However, it takes a degree of 'data mining' to use this data effectively.
What does data mining mean? Data mining in technical terms means examining large data sets to find new information. In short, it means actually using your data to gain meaningful insights about your customers. These insights could be based upon patterns of data, related datasets and common trends.
For example, your monthly sales are down on your website and you notice your bounce rate has also increased within that same month. You could deduce that your reduction in sales has occured in part because of more customers leaving your website. This may spur you to think about how you can decrease your bounce rate to help improve sales.
How do you make effective judgements? Surely you can't just guess which datasets make sense together? You're right, it takes a little wisdom and thought to carefully mine data.
As a basic guide, we'd recommend:
- Listing your KPIs
- Next to each KPI, writing all the factors which could affect this KPI (it may well be another of your KPIs!)
- Check each of these 'factors' alongside your KPI's, to examine for any trends
However, we understand that there is an art to understanding your website data. If you'd like any guidance on getting started or you'd like some support interpretting your data, please don't hesitate to get in touch and our team of marketing specialists shall be able to help you.

