
Tracking Audience Engagement on your Site
As a business owner, it's critical that you are in touch with your customers. If you are non e-Commerce, then it's just as important that you are aware what your visitors are engaging with. You can use this information to optimise your site to reflect better what they are interested in, and sell more to people who are searching and on your site.
You should be able to answer these questions:
- What are my visitors interested in?
- What pages are they clicking on?
- How many times to do they visit before they buy?
- Where are they entering/exiting the site?
- Where do they spend the most time?
- What can I do with this information?
This guide will help you focus your efforts to impact to your sales / call to action.
"How many hits am I getting?"
The internet has moved a long way since this question. No longer do we consider "hits" or "traffic", but rather talk about Unique users, Sessions, Session duration, Entry/Exit pages, and behaviour flow.
Let's dig into some data to examine how your audiences engage with your site.
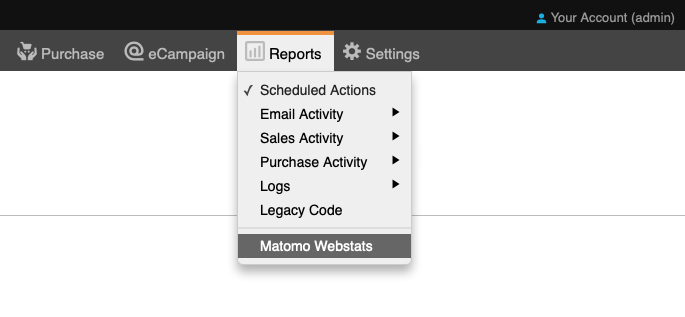
1) Log into Matomo
From your iPages dashboard, go to Reports->Matomo Webstats. This will log you into your account.
2) Understanding the terminology
| Term | Meaning |
| Pageviews | The number of views that page got |
| Unique Pageviews | The number of visits that included this page, de-duplicated by visitor |
| Bounce Rate (%) | The % of sessions that started and ended on this page. (Left immediately) |
| Exit Rate (%) |
Sessions that exited from this page divided by Sessions that included this page |
| Outlink |
A link a user clicked that took them away from your site |
3) Examine the customer journey
Go to Behaviour -> Transitions
This shows you the Central page in question, and it's sources (from the left) and it's destinations (to the right)
This can be really useful for understanding what customers are doing and how they are navigating around your site.
Top tip: Use this on your best sellers and examine the user journey. Where do they come from? Where to they go to? How many actions do they take before arriving at the call to action?
A note about Google Analytics: If you use Google Analytics, they have their own definitions you can read more about here.
4) Visitor Behaviour
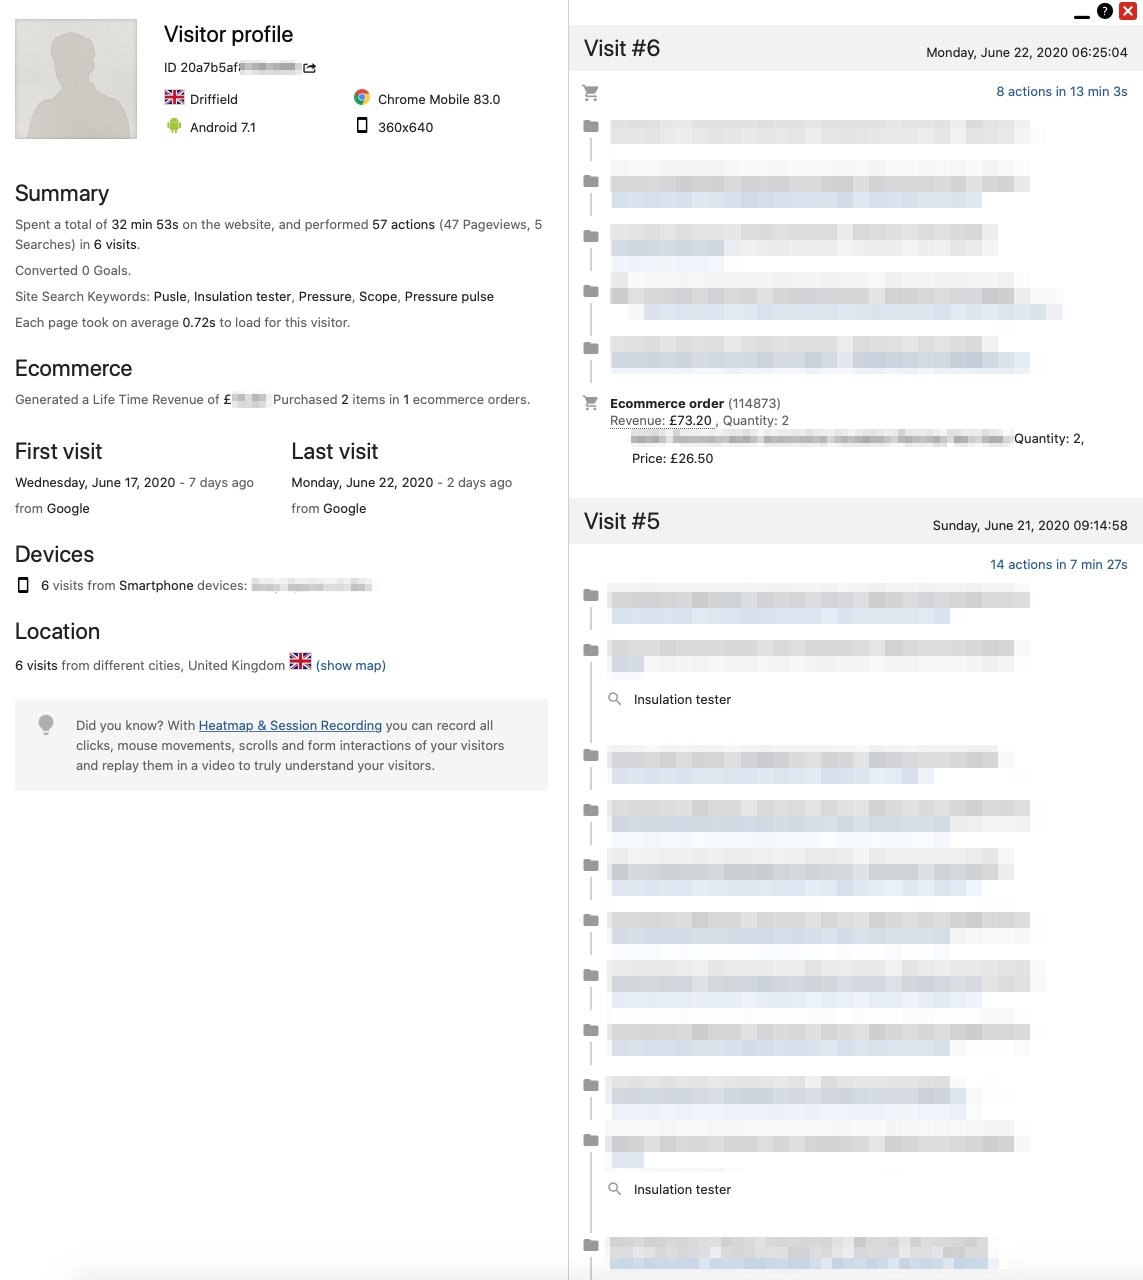
A) eCommerce Activity and Visit History.
Here you can see User engagement and what they did on each visit to your site.
You can see what they searched for, how long they spent in the session and what actions they took.
It's not uncommon to see people having several visits before they buy.
Find these in eCommerce- eCommerce Log.
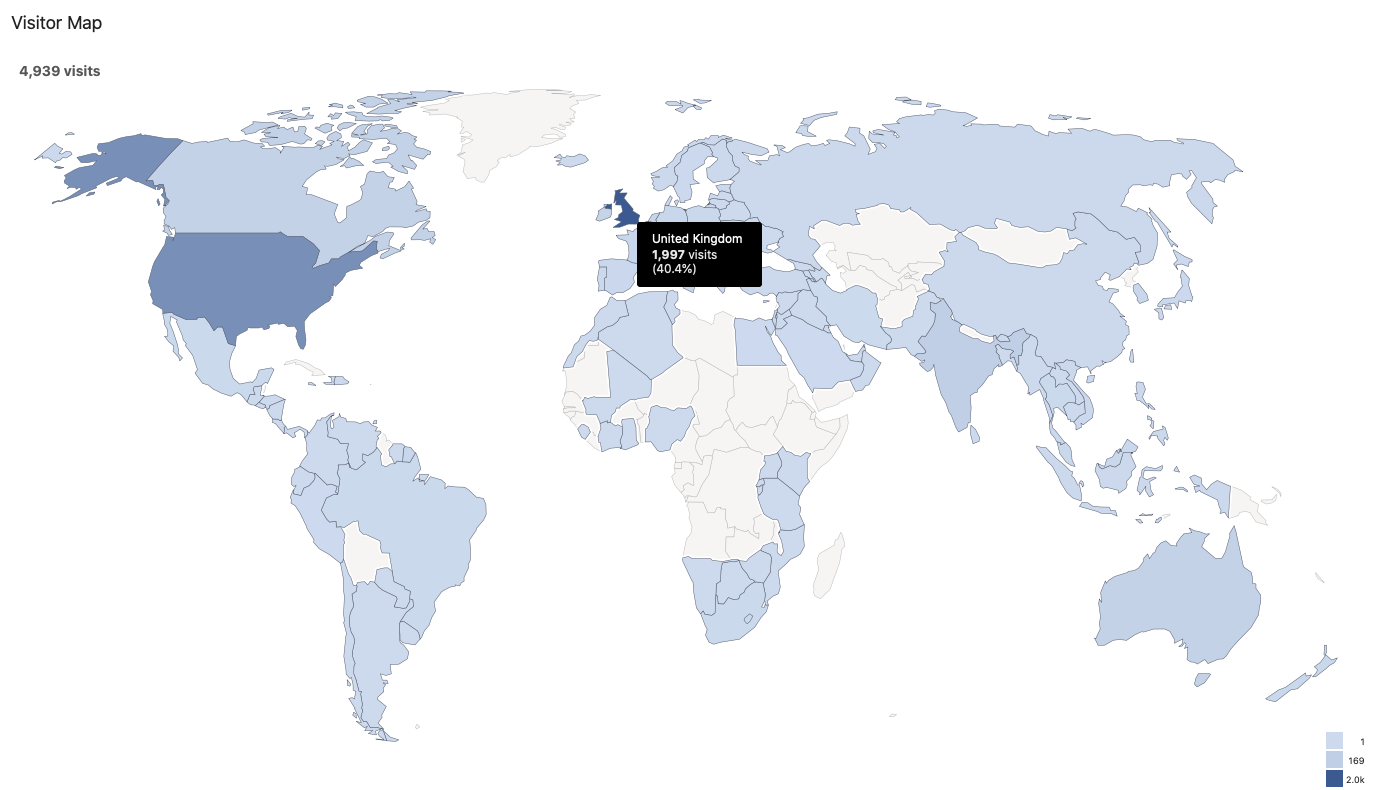
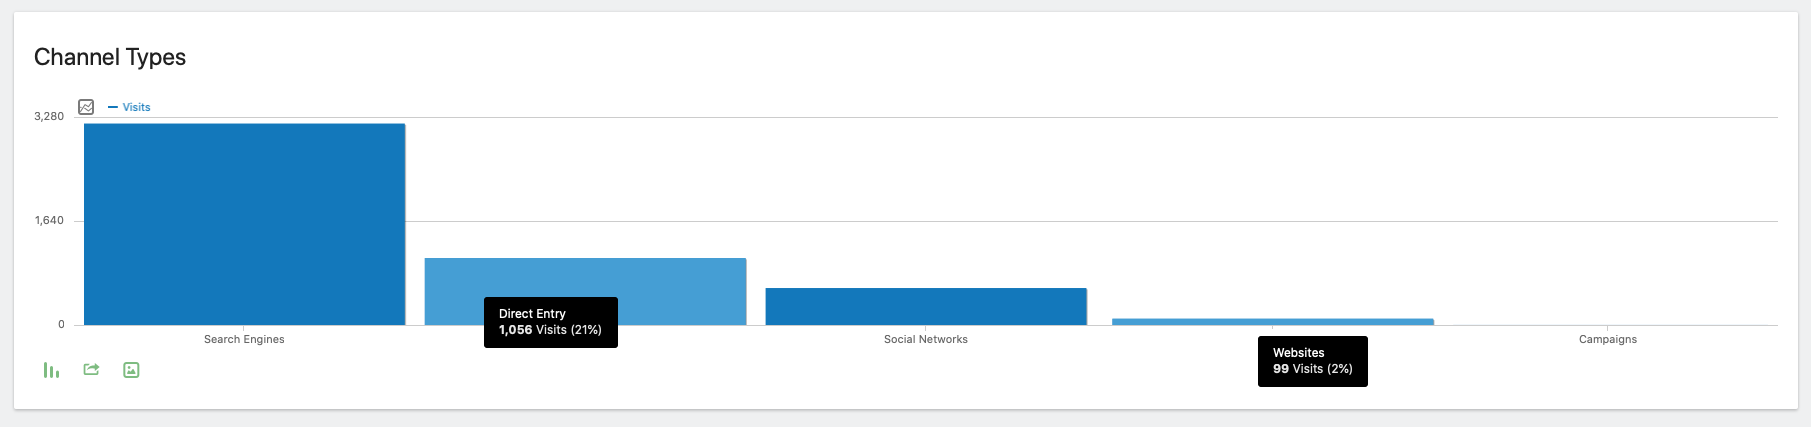
B) Examine your channels
This will help you understand where your visitors come from.
A large "Direct entry" proportion means people already knew your website and brand.
A large "Social networks" proportion means you are performing well on Social media channels.
This can be useful to compare vs Advertising spend, so if you are using GoogleAds you can link these in Google Analytics. Alternatively use the report from Matomo and restrict by channel source, and compare vs your advertising spend for that window of time.
C) Examine your sales by channel
Go to eCommerce - Overview
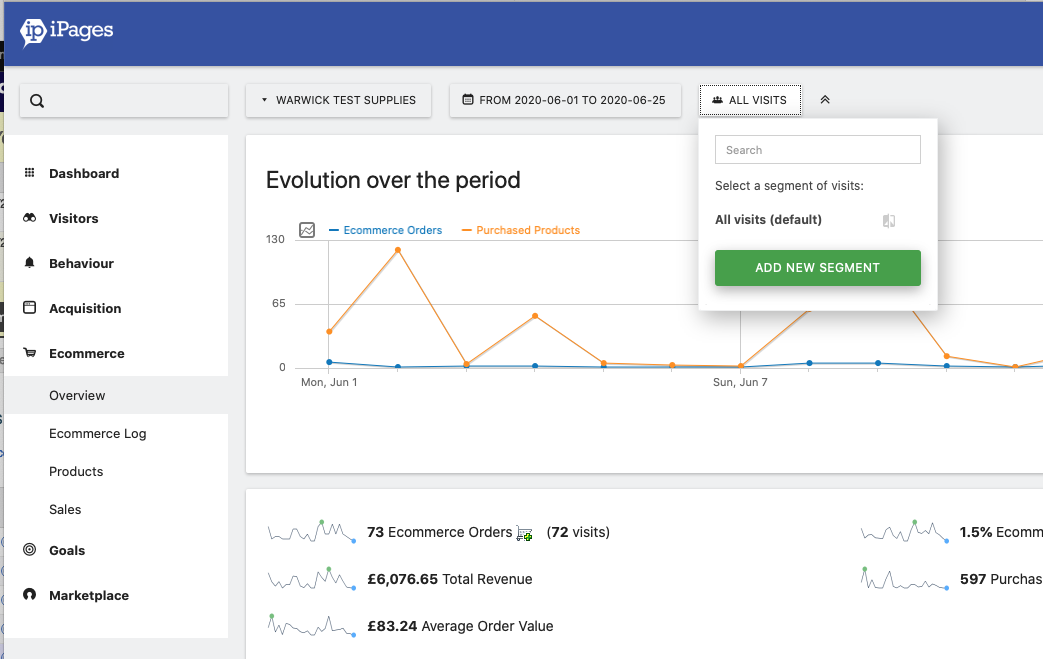
Add a new segment with the rule: Channel Type IS Social
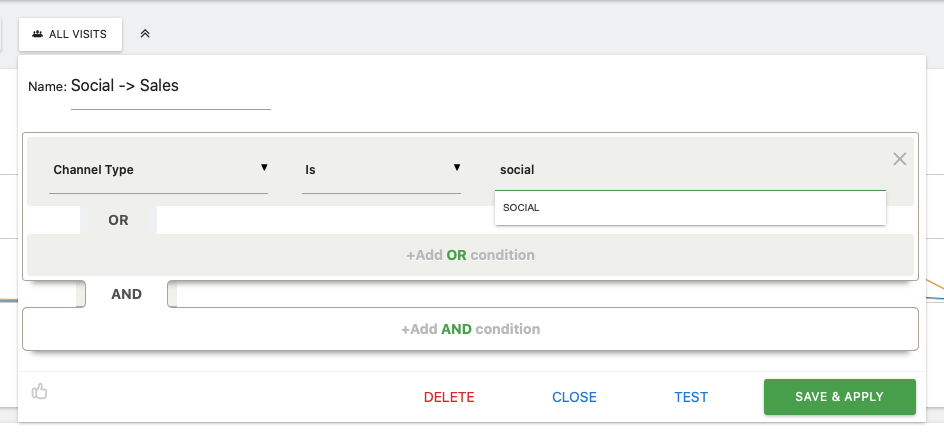
Then hit Save and Apply.
(You could do similarly with other channel sources.)
You can now see all sales to visitors that came from a certain channel.
D) See your most viewed pages
Go to Behaviour - Page Titles
Make sure your date range is set correctly
Action: Pay attention to your most viewed pages. You will probably find 80% of your unique page views apply to a small number of pages. You will want to ensure these top pages are nicely designed, have strong imagery, and clear call-to-actions.
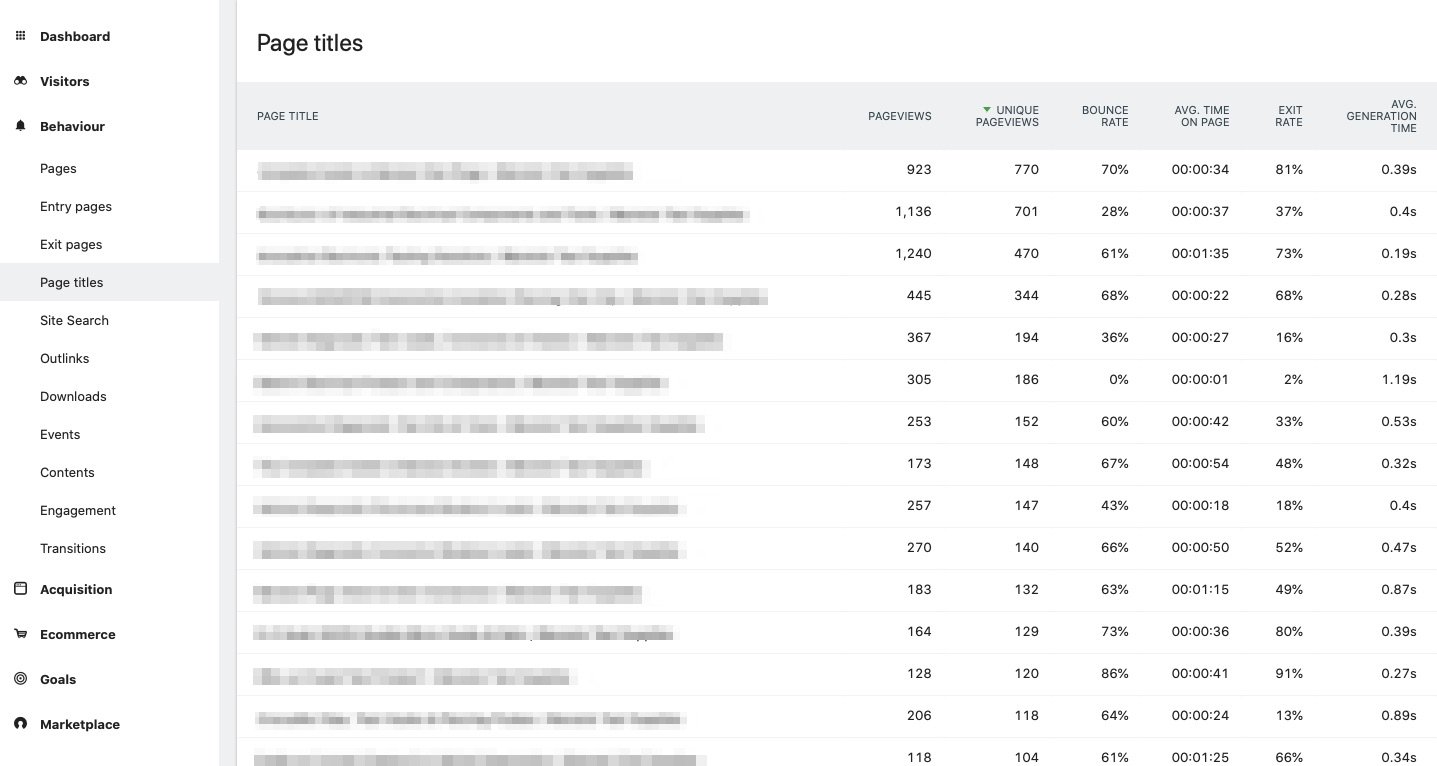
These are the pages you want to spend time optimising.
E) Work on your exit rate
It's natural that visitors leave your site, but maybe you have a 'leaky funnel' problem where visitors are leaving before they take the action you want them to take.
Go to Behaviour - Exit pages
Sort Exits - High to Low.
Look for pages with a high (>70%) exit rate.
People are leaving these pages.
These are the pages you want adjust to try to retain visitors. Try A/B testing alternative layouts/text and links.
F) Stop People bouncing off your site
You've done the hard work getting a visitor to land on your site, but they left immediately.
Go to Behaviour - Entry pages
Sort Entrances - High to Low.
Look for pages with a high (>70%) bounce rate.
People are bouncing immediately off these pages.
These are the pages you want adjust to try to retain visitors. Try A/B testing alternative layouts/text and links.
A reminder that 'bounce' means entry+exit on that one page. 'Exit' means they left on that page as a proportion of total sessions including that page.
There is much you can do with Matomo stats - see also our guide to GoogleAds for tips and hints as to how these can help probe your demographics and audience more.